Using Project Gantt Chart in ERPNext
Guide
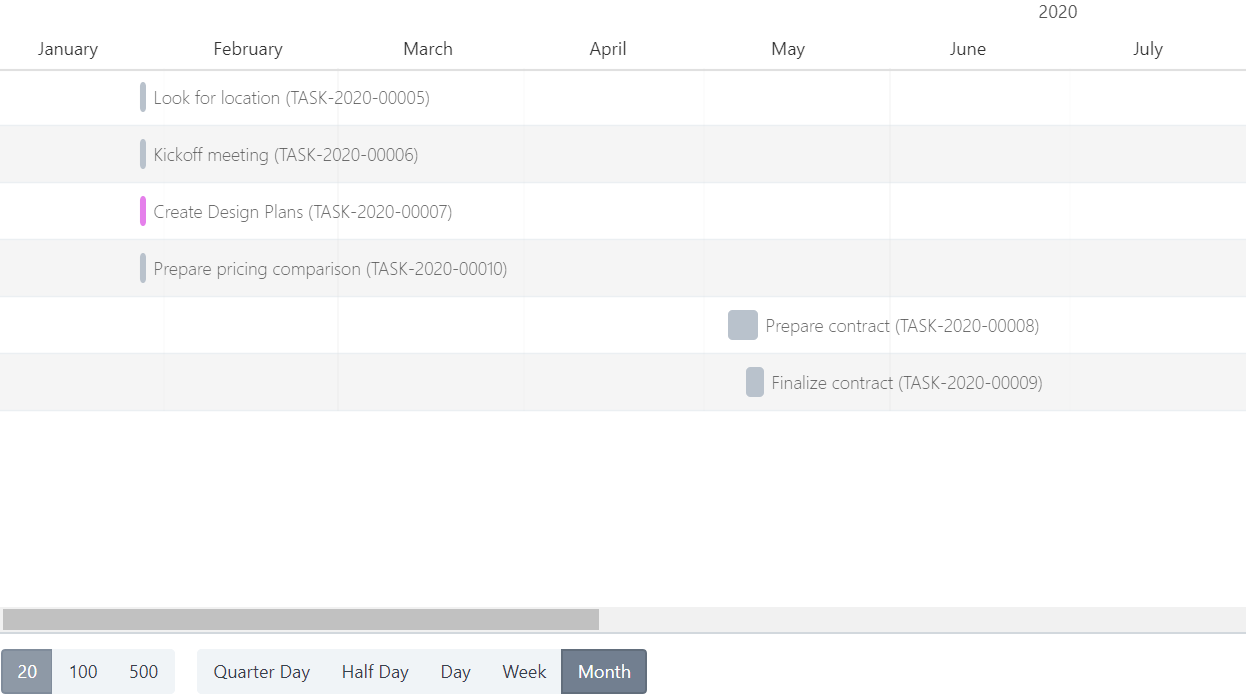
A Gantt chart is a bar chart that illustrates a project schedule. This is a useful tool in monitoring schedules as well as project deliverable.
A. To view your project’s Gantt chart, click on the Gantt Chart button on the upper right of your project screen.
*Note that the Gantt chart will be empty if no tasks have been created for the project
B. View your Gantt chart by quarter day, half day, day, week or month
C. To have your tasks organized by color, go to the task, select a color and save.


